Rodents in Connecticut: What U.S. Census Data Reveals About Where They’re Showing Up

Rodents are appearing in Connecticut homes more often than many residents may realize—and for the first time, new U.S. Census Bureau data provides a clearer picture of where and how frequently that’s happening.
According to an experimental county-level analysis released by the Census Bureau, more than one in seven occupied housing units in Connecticut showed signs of rodents or reported rodent sightings during a recent 12-month period. The estimates are derived from the American Housing Survey and represent one of the most detailed looks yet at rodents in Connecticut homes, broken down by county.
Unlike complaint logs or anecdotal reports, the Census data focuses specifically on rodent signs or sightings inside occupied residential housing units, offering a standardized way to compare communities across the state. While the estimates are model-based and labeled experimental, they fill a long-standing gap in understanding how rodent activity varies across Connecticut’s mix of urban, suburban, and rural areas.
The data suggests that rodent issues in Connecticut are not confined to any single type of community. Instead, they appear to be closely tied to housing age, winter climate, and development patterns—raising broader questions about housing quality and infrastructure across the state.
Rodents in Connecticut by the Numbers
When the county estimates are aggregated statewide, they reveal a pattern that is both widespread and unevenly distributed.
Overall, the data suggests that roughly one in seven occupied housing units in Connecticut experienced rodent signs or sightings inside the home during a recent 12-month period. In practical terms, that represents hundreds of thousands of households statewide encountering rats or mice at least once over the course of a year.
This does not mean that all of these homes had ongoing infestations. The measure reflects whether a household experienced rodent activity at any point during the year—from a brief sighting to more persistent evidence.
How Connecticut Compares to Other States
At the national level, rodent sightings in homes are not unusual. However, Connecticut’s estimated share of affected households falls above the national average, placing it among states where residential rodent encounters are relatively common.
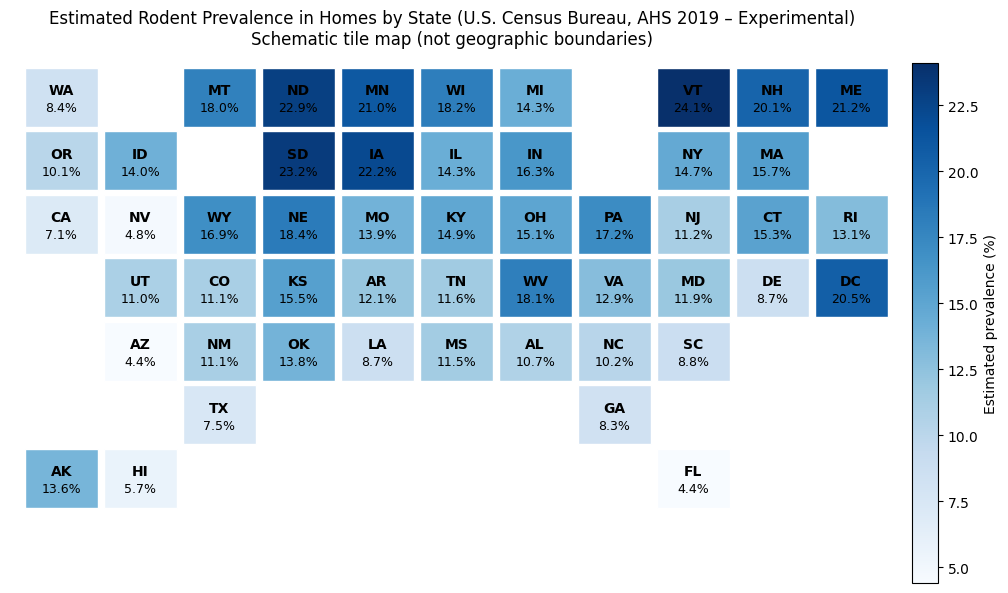
This aligns with several defining characteristics of Connecticut housing:
- A large share of older homes, many built before modern building codes
- Cold winters, which drive rodents indoors
- A mix of rural, suburban, and urban development, each with distinct risk factors
Rather than being driven by a single hotspot, the statewide figure reflects cumulative conditions across very different communities.
Percentages vs. Households
The data also highlights an important distinction between prevalence and total households affected.
- Smaller or more rural counties may show higher percentages of homes with rodent signs
- Larger counties may account for more total affected households, even with lower percentages
Both perspectives matter, and together they help explain how rodent exposure is distributed across the state.
Which Connecticut Counties Are Most Affected
Looking beyond statewide averages, the Census estimates show meaningful variation by county.
Counties With the Highest Estimated Prevalence
Counties with a higher share of rural housing and older building stock tend to show the highest percentages of homes reporting rodent signs. In Connecticut, this places counties such as Windham and Litchfield near the top of the list.
Mid-sized counties like Tolland and Middlesex also show elevated prevalence compared to the state’s largest population centers, reinforcing that rodent exposure is not strictly an urban issue.
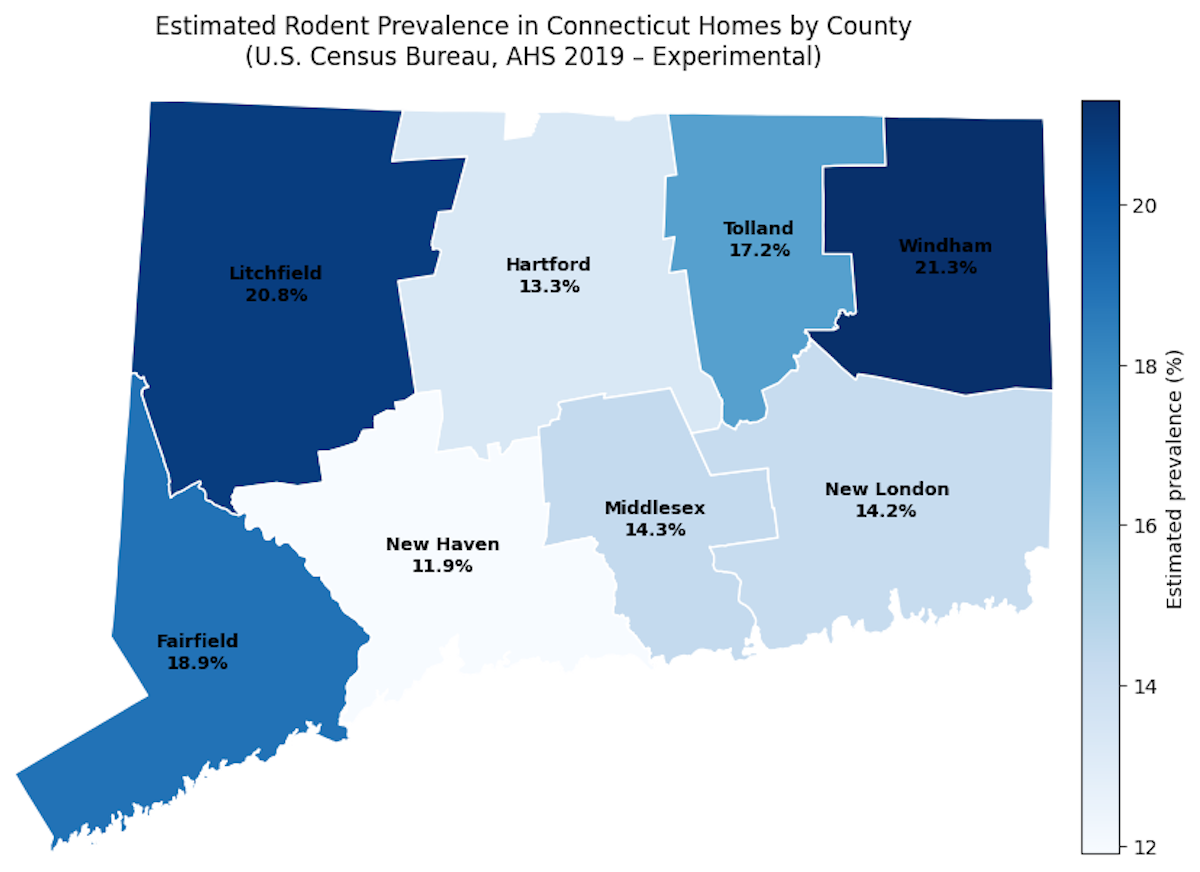
Counties With the Most Households Affected
When counties are ranked by the total number of households affected, a different pattern emerges.
Counties with large populations and dense housing—most notably Fairfield, Hartford, and New Haven counties—account for a substantial share of Connecticut’s total rodent-affected homes, even if their prevalence rates are lower than those of more rural counties.
This contrast highlights a key takeaway:
- Rural and semi-rural counties tend to have higher rates
- Urban and suburban counties tend to have higher absolute numbers
No Connecticut county shows negligible rodent presence in the estimates. Every part of the state registers a meaningful share of households reporting rodent activity over the course of a year.
Why Rodents Appear More Often in Certain Parts of Connecticut
The patterns in the data point to structural explanations rather than random variation.
Older Housing Stock
One of the strongest predictors in the Census model is housing age, particularly homes built before 1960. Older homes are more likely to have unsealed foundations, aging sill plates, and gaps created by decades of renovations—all potential entry points for rodents.
Cold Winters
Average winter temperatures also matter. Colder January temperatures are associated with higher reported rodent activity, reflecting a simple reality: rats and mice seek warmth indoors when outdoor conditions deteriorate.
Rural and Single-Family Housing
Rural and semi-rural counties often contain more single-family homes surrounded by open land, sheds, and outbuildings. These environments support rodent populations and provide more direct ground access than upper-floor urban units.
Together, these factors suggest that rodent presence in Connecticut homes reflects long-term housing and environmental conditions—not short-term anomalies.
Here's what to do if you see mice in your home
What the Census Actually Measured (and What It Didn’t)
To interpret this data correctly, it’s important to understand exactly what the Census Bureau measured. Full study: County-level Model-based Estimates from 2019 American Housing Survey: Signs of Rodents.
The estimates are based on responses from the American Housing Survey (AHS), a long-running national survey focused on housing conditions. For this analysis, the Census examined whether occupied housing units reported signs of rodents or rodent sightings inside the home during a 12-month period, roughly covering 2018–2019.
This measure is binary: a household either reported rodent signs during that period or it did not. The survey groups rats and mice together under the category of “rodents.”
Equally important is what the data does not measure. The Census estimates apply only to occupied residential housing units. They do not include rodents in restaurants, commercial buildings, sewers, parks, or other public spaces. They also do not capture how severe a rodent issue was, how long it lasted, or whether it was resolved.
Because the American Housing Survey is not designed to produce reliable results for every county on its own, the Census Bureau used statistical modeling to generate county-level estimates. As a result, the figures are labeled experimental—intended to inform analysis and public understanding rather than serve as precise counts.
Why the Census Used a Model to Estimate Rodents by County
The county-level figures in this dataset are modeled estimates, not simple tallies from survey responses alone.
In many counties—especially smaller or more rural ones—the American Housing Survey includes only a small number of sampled households, or none at all. Relying solely on raw survey responses would produce unstable or misleading results.
To address this, the Census Bureau used a technique known as small area estimation, a method commonly applied in official statistics when local survey data is limited. This approach combines available survey responses with county-level characteristics that are strongly associated with rodent presence in homes.
For this analysis, those characteristics include:
- The age of the housing stock, particularly the share of homes built before 1960
- Average winter (January) temperatures
- Population size
- The share of housing located in rural areas
Counties with stronger direct survey signals rely more heavily on observed data, while counties with sparse data rely more on modeled relationships. The result is a consistent national framework that still reflects local housing conditions.
The Census Bureau emphasizes that these estimates are best used to identify patterns, not to diagnose conditions in individual homes. Still, the approach allows for something that has long been missing: a way to compare rodent presence in homes across Connecticut counties using a single, transparent methodology.
Rats vs. Mice: What the Data Can (and Can’t) Tell Us
The Census data does not distinguish between rats and mice. This is intentional.
Residents are often unable to reliably identify rodent species, especially when evidence consists of droppings or sounds rather than direct sightings. Grouping rodents together improves reporting consistency and makes county-level comparisons more reliable.
From a housing perspective, the distinction between rats and mice is less important than the underlying issue: rodents are able to enter and remain inside homes. The Census data focuses on that fundamental condition rather than species-level detail.
What This Data Means for Homeowners and Communities
The findings reinforce that rodent encounters are not typically the result of individual mistakes. Instead, they reflect shared housing characteristics across neighborhoods and regions.
Common risk factors include:
- Aging foundations and framing
- Gaps around pipes, vents, and utilities
- Basements, crawl spaces, and attached garages
- Outdoor features such as woodpiles and sheds
At the community level, widespread rodent exposure points to systemic housing conditions, not isolated properties.
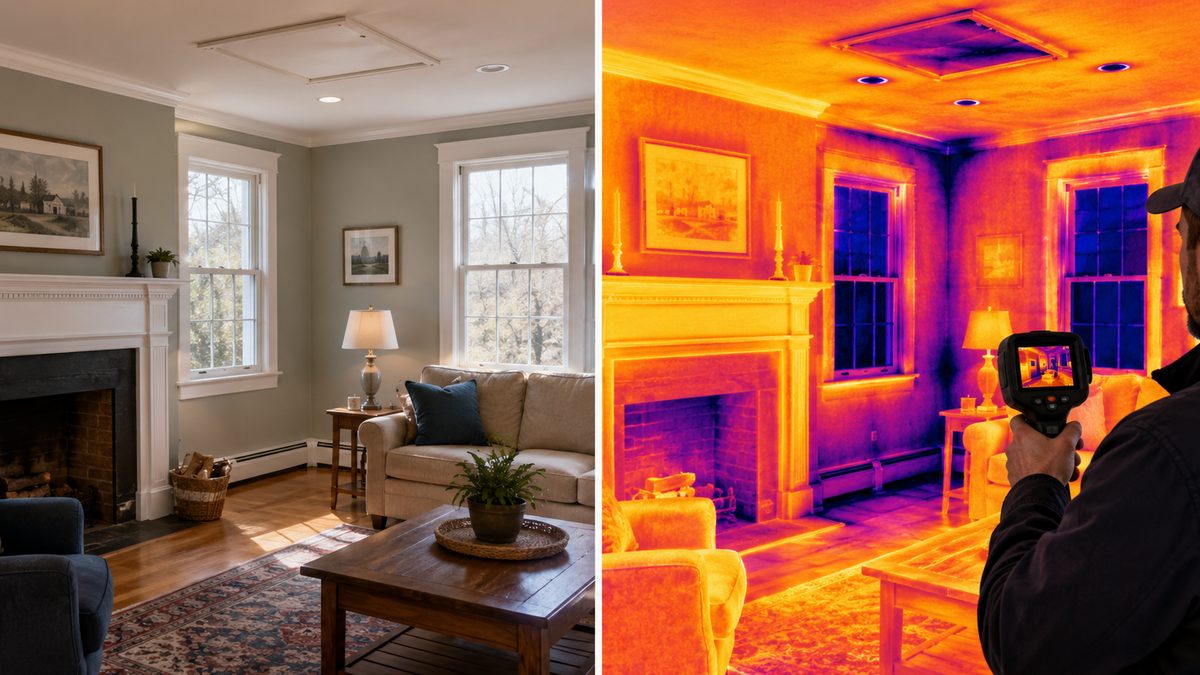
Why This Matters Beyond Pests
Rodents are often a symptom, not the root problem.
The same conditions that allow rodents into homes—gaps, drafts, aging structures—also contribute to energy loss, moisture issues, and long-term housing deterioration. In this way, rodent presence intersects with housing quality, public health, and energy efficiency.
Seen through that lens, the Census data becomes part of a broader conversation about how Connecticut’s aging housing stock is performing under modern expectations.
Learn more about how insulation protects air quality in your home
Methodology and Data Sources
This analysis is based on an experimental dataset released by the U.S. Census Bureau, derived from the 2019 American Housing Survey and modeled using small area estimation techniques.
- Unit of analysis: Occupied housing units
- Measure: Rodent signs or sightings during a 12-month period
- Geography: County-level
- Confidence intervals: 90%
- Status: Experimental
The full dataset and technical documentation are available from the U.S. Census Bureau’s Small Area Estimates of Rodent Signs in Housing Units.
Key Limitations of the Census Rodent Data
The Census Bureau notes several important limitations:
- The estimates are experimental and model-based
- They apply only to occupied residential housing units
- They do not measure severity, duration, or frequency
- Housing type influences reporting rates
These limitations do not diminish the value of the data, but they define how it should be used: as a high-level housing indicator, not a precise count.
The Takeaway
The Census data does not suggest a sudden rodent crisis in Connecticut. What it reveals is something quieter and more persistent: rodent encounters are a routine feature of the state’s housing landscape, shaped by age, climate, and structure.
Understanding where rodents appear—and why—offers insight into the condition of Connecticut homes themselves. In that sense, the data is less about pests and more about housing: how it’s built, how it’s aging, and how well it’s holding up over time.
Concerned about what this data means for your home?
Rodent activity often points to gaps, drafts, and aging building conditions that aren’t always visible from the inside. If you want a clearer picture of how your home is holding up—and where issues may be starting—an inspection can help identify what’s happening behind the walls.
👉 Learn more or request an estimate with Nealon Insulation.
Related Articles

Let's Work Together
Ready to transform your home into an energy-efficient haven? Schedule your free energy assessment today and experience the Nealon difference for yourself.